


 41 / 59

Ref. No. [UMCES] CBL 2015-008
ACT VS15-01
41
Great Lakes Field Test Site
A month-long moored field test was conducted in Lake Michigan from June 21 to July
19, 2014. The Great Lakes deployment site was located at 43.23°N, 86.34°W on a fixed pier at
the Lake Michigan Field Station of the NOAA Great Lakes Environmental Research Laboratory,
in Muskegon, Michigan. The site is located at the outfall of Lake Muskegon into Lake Michigan
with a depth of approximately 3 meters. The temperature range during deployment was 11.6°C
through 24.9°C and salinity averaged 0.031.
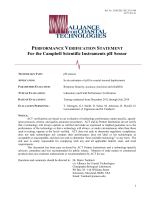
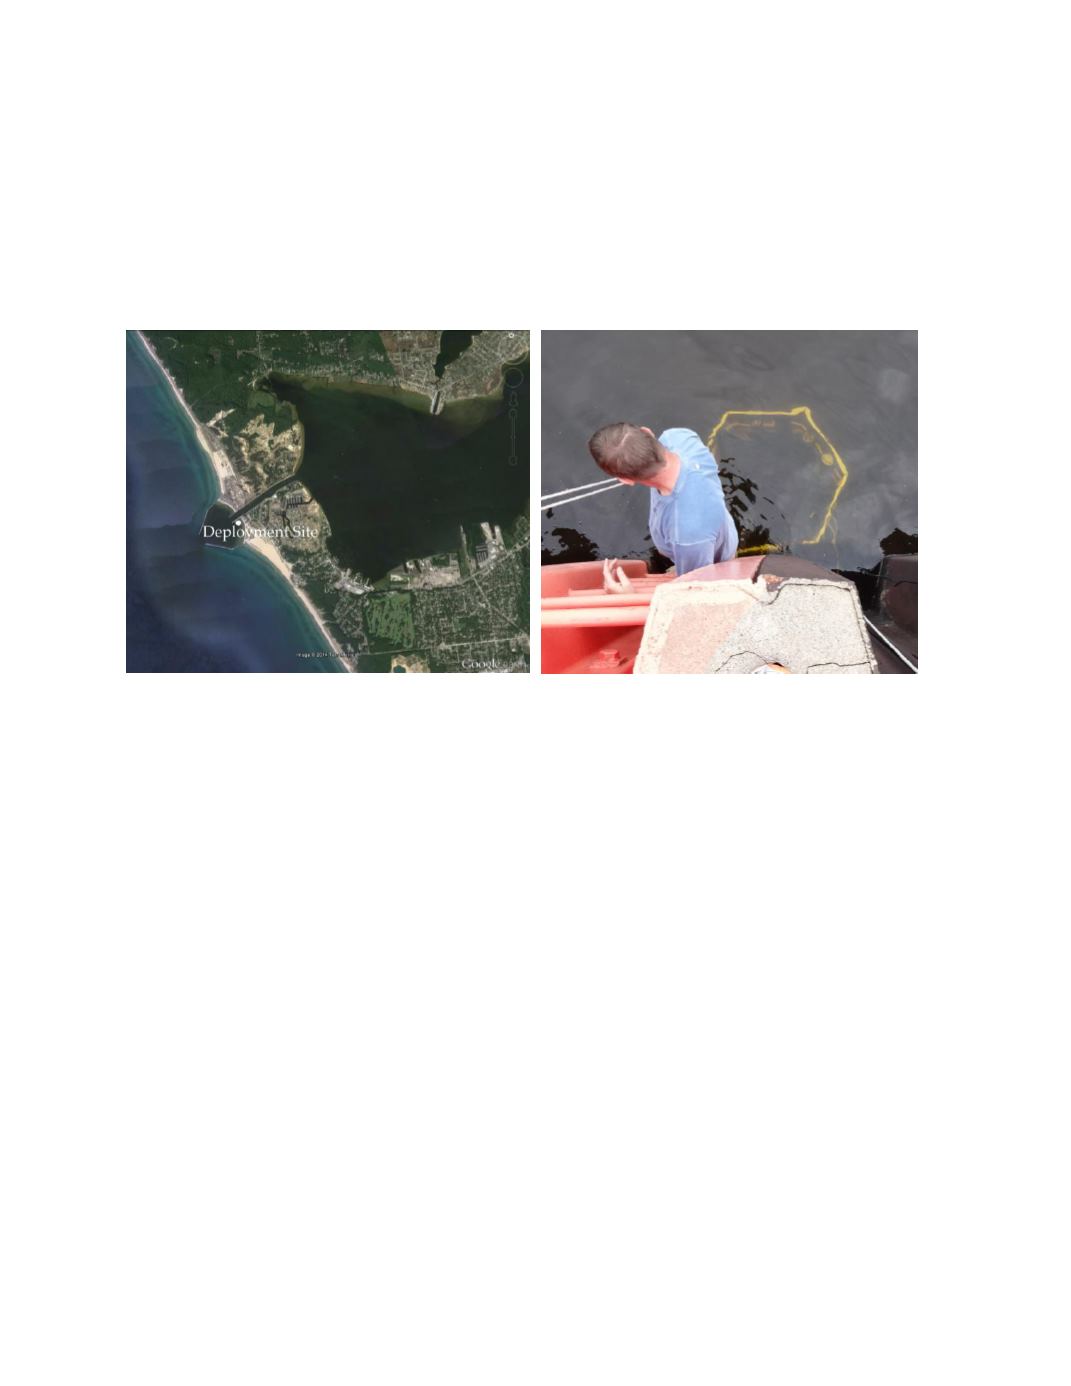
Photo 8.
Aerial view of Lake Michigan and Muskegon Lake (left) and rack deployment at GL Site.
Time series results of ambient conditions for water depth, temperature, and salinity are
given in figure 17. Temperature ranged from 11.6 to 24.9 and salinity from 0.024 to .035 over
the duration of the field test. While there are no tidal cycles at this site there was significant
exchange between the open lake and the protected basin within the break wall as evidenced by
changes in salinity and water depth. The bottom panel displays the maximum difference recorded
between all reference thermistors mounted at the same depth across the mooring rack. The
average temperature difference observed across the space of the mooring rack was 0.08 ±0.18
o
C
with a maximum of 2.53
o
C. As noted above, it is not possible to quantify the exact difference
between the averaged reference temperature and that measured by the test instrument, but
differences resulting from this variation and variation in the chemistry of the water across will be
minimized because the sampling bottle integrates across the mooring space.
The CSI-pH operated continuously over the 29 days of the deployment and generated
2680 observations at 15 minute intervals. The range in ambient pH measured by the CSI-pH was
7.240 to 7.946 compared to 8.013 to 8.526 for the reference pH measurements (Fig. 18). The
bottom panel presents the time series of the difference between the CSI-pH and reference pH for
each matched pair (n=98 observations). The average and standard deviation of the difference for
the entire deployment was -0.676 ± 0.109 with a total range of -0.894 to -0.517.