Ref. No. [UMCES] CBL 2013-020
        
        
          ACT VS12-03
        
        
          QUALITY ASSURANCE/QUALITY CONTROL
        
        
          Quality Assurance (QA)/Quality Control (QC) procedures were performed in accordance
        
        
          with the Test Protocols for this verification test, except where noted specifically within this
        
        
          report.  Changes as noted had no impact on the quality of the results. QA/QC procedures and
        
        
          results are described below.
        
        
          Quality Control Samples
        
        
          Three types of QA samples were collected as part of our discrete reference sampling
        
        
          protocols: laboratory duplicates, field duplicates, and field trip blanks.  Lab duplicates were
        
        
          repeated analysis from the same field collected sample.  Field duplicates were two separate field
        
        
          samples collected as close in time and space as possible and processed identically.  Field trip
        
        
          blanks were milli-Q DI that was carried into the field in a Van Dorn sampling bottle and then
        
        
          processed identically alongside a normal reference sample.  Only one reference sample/field
        
        
          duplicate pair from Baltimore Harbor had a detectable hydrocarbon concentration and the
        
        
          detection was only observed for the field replicate and not the reference sample pair.  A
        
        
          summary of the relative percent difference and precision within the QA samples for our ancillary
        
        
          measurements of turbidity, chlorophyll, and CDOM are presented in tables 5-7.  QA results for
        
        
          hydrocarbon concentrations in field samples could not be computed, except for the Wave Tank
        
        
          test, because almost all samples were below detection.  The average relative precision (95%
        
        
          confidence interval) among triplicate hydrocarbon determinations over all 5 trials was 20
        
        
          percent, with a range of 1 – 40 percent for this test.
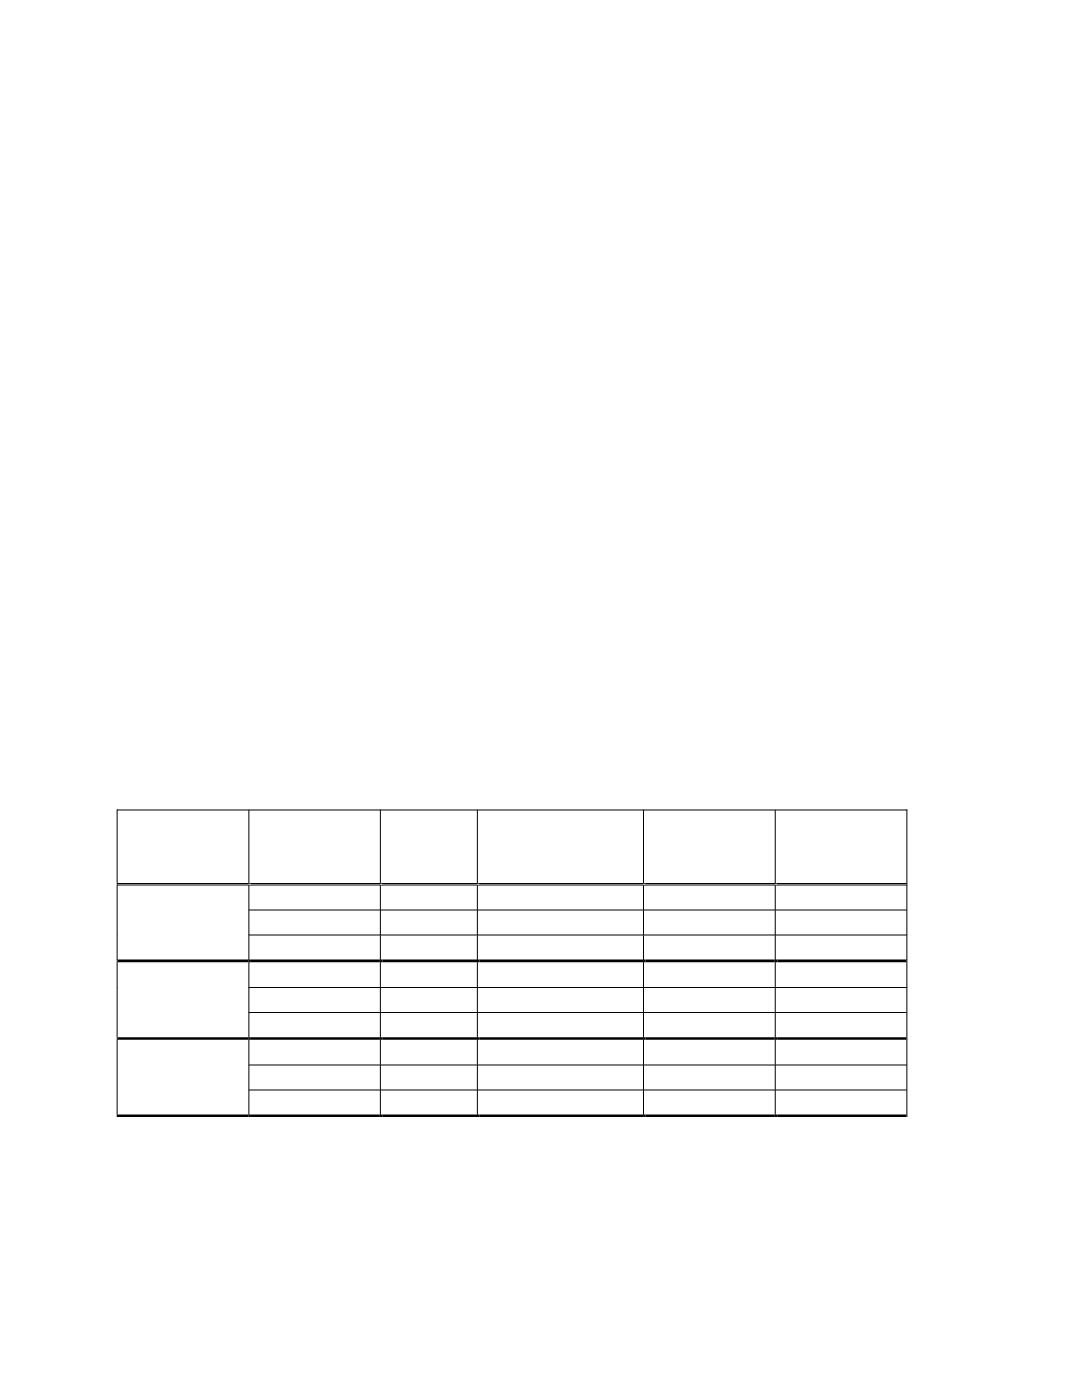
        
        
          Table 5.
        
        
          Turbidity results for laboratory duplicates and field duplicates of reference samples for the two
        
        
          field test sites in Baltimore Harbor, site 2 in the Gulf of Mexico, and the Wave Tank experiments
        
        
          performed at the Bedford Institute of Oceanography (BIO), Halifax, Nova Scotia. Samples were analyzed
        
        
          on-site with a benchtop Hach 10AN turbidometer.
        
        
          Site
        
        
          QA Sample
        
        
          Type
        
        
          # obs
        
        
          Mean (s.d.)
        
        
          95% C.I.
        
        
          Absolute
        
        
          Precision
        
        
          Average
        
        
          Relative %
        
        
          difference
        
        
          Baltimore
        
        
          Harbor
        
        
          Field Blank
        
        
          3
        
        
          0.11  (0.05)
        
        
          0.99
        
        
          na
        
        
          Lab Dup
        
        
          2
        
        
          4.1    (0.1)
        
        
          0.09
        
        
          6.1
        
        
          Field Dup
        
        
          7
        
        
          2.6    (0.2)
        
        
          0.19
        
        
          13.3
        
        
          Gulf of
        
        
          Mexico
        
        
          Field Blank
        
        
          0
        
        
          nd
        
        
          1
        
        
          nd
        
        
          1
        
        
          nd
        
        
          1
        
        
          Lab Dup
        
        
          0
        
        
          nd
        
        
          2
        
        
          nd
        
        
          2
        
        
          nd
        
        
          2
        
        
          Field Dup
        
        
          5
        
        
          3.2    (0.02)
        
        
          0.02
        
        
          1.6
        
        
          BIO Wave
        
        
          Tank
        
        
          Field Blank
        
        
          1
        
        
          0.04
        
        
          na
        
        
          na
        
        
          Lab Dup
        
        
          7
        
        
          0.69  (0.04)
        
        
          0.10
        
        
          6.9
        
        
          Field Dup
        
        
          5
        
        
          1.37  (0.08)
        
        
          0.12
        
        
          8.6
        
        
          nd
        
        
          1
        
        
          :  no data; field trip blank was not collected during profiling
        
        
          nd
        
        
          2
        
        
          :  no data; lab duplicates for CDOM were not collected during profiling
        
        
          na:  not applicable
        
        
          68