Ref. No. [UMCES] CBL 2013-020
ACT VS12-03
RESULTS of WAVE TANK TEST
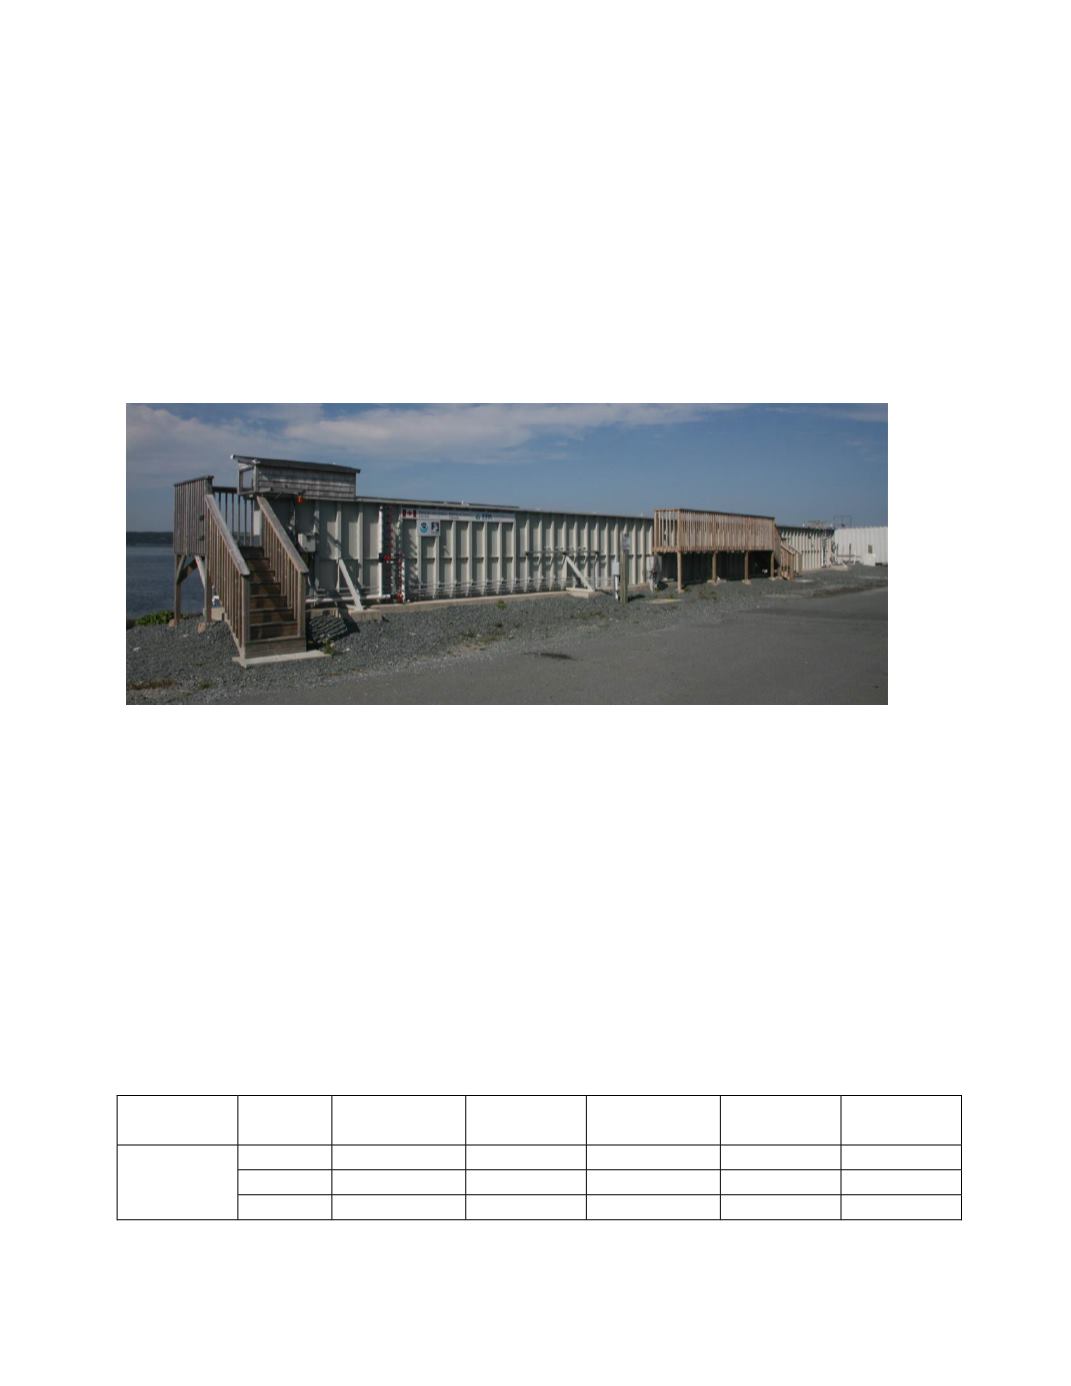
Tests were conducted at the Bedford Institute of Oceanography’s (BIO) Center for
Offshore Oil, Gas and Energy Research (COOGER) in their 32 m wave tank facility. This wave
tank was constructed at the BIO in collaboration between Fisheries and Oceans Canada (DFO)
and the U.S. Environmental Protection Agency (EPA) for controlled oil dispersion studies (Photo
3). The wave tank is able to continually produce breaking waves at precise locations in the tank
(Photo 4) and is fully equipped to enable measurements of dispersed oil in the water column. The
tank is equipped with a flap-type wave maker that generates waves with periods varying from
about 0.5 to 1.5 seconds. On the opposite end of the tank, a series of inclined screens is in place
to absorb wave energy and minimize reflection.
Photo 3.
Bedford Institute of Oceanography’s Wave Tank
Oil additions were performed by BIO research staff using established protocols. In brief,
oil was first added to two liters of the ambient bay water and mixed on a shaker plate for
approximately 15 minutes, with or without dispersant depending on the test. The oil slurry was
then poured slowly into the wave generating end of the tank (Photo 5 and 6) and allowed to be
mixed by wave motion. Oil concentrations become uniformly distributed throughout the tank
after approximately 30 minutes of mixing. A summary of the test conditions and background
water quality concentrations of the seawater used during oil additions are provided in Table 2.
Temperature and salinity conditions were consistent over the test period and chlorophyll and
CDOM levels were relatively low.
Table 2.
Comparison of ancillary physical and water quality conditions for hydrocarbon sensor
verification tests conducted in the wave test tank at the Bedford Institute of Oceanography, Halifax, Nova
Scotia.
Site
Temperature
(
o
C)
Salinity
Chlorophyll
(µg/L)
CDOM
A
400
, m
-1
Turbidity
(NTU)
BIO Wave
Tank
Min
8.3
14.5
0.1
0.61
0.3
Max
9.5
15.8
0.9
1.33
5.0
Mean
8.9
15.6
0.5
0.95
1.5
20


