Ref. No. [UMCES] CBL 2013-020
ACT VS12-03
RESULTS of LABORATORY TEST
Laboratory tests of response factor, precision, range, and reliability were conducted at
Moss Landing Marine Lab utilizing five different challenge compounds covering a range of
fluorescent properties (see Table 1 above) to facilitate comparisons against the range of optical
detection windows utilized by participating hydrocarbon sensors. Tests were performed in
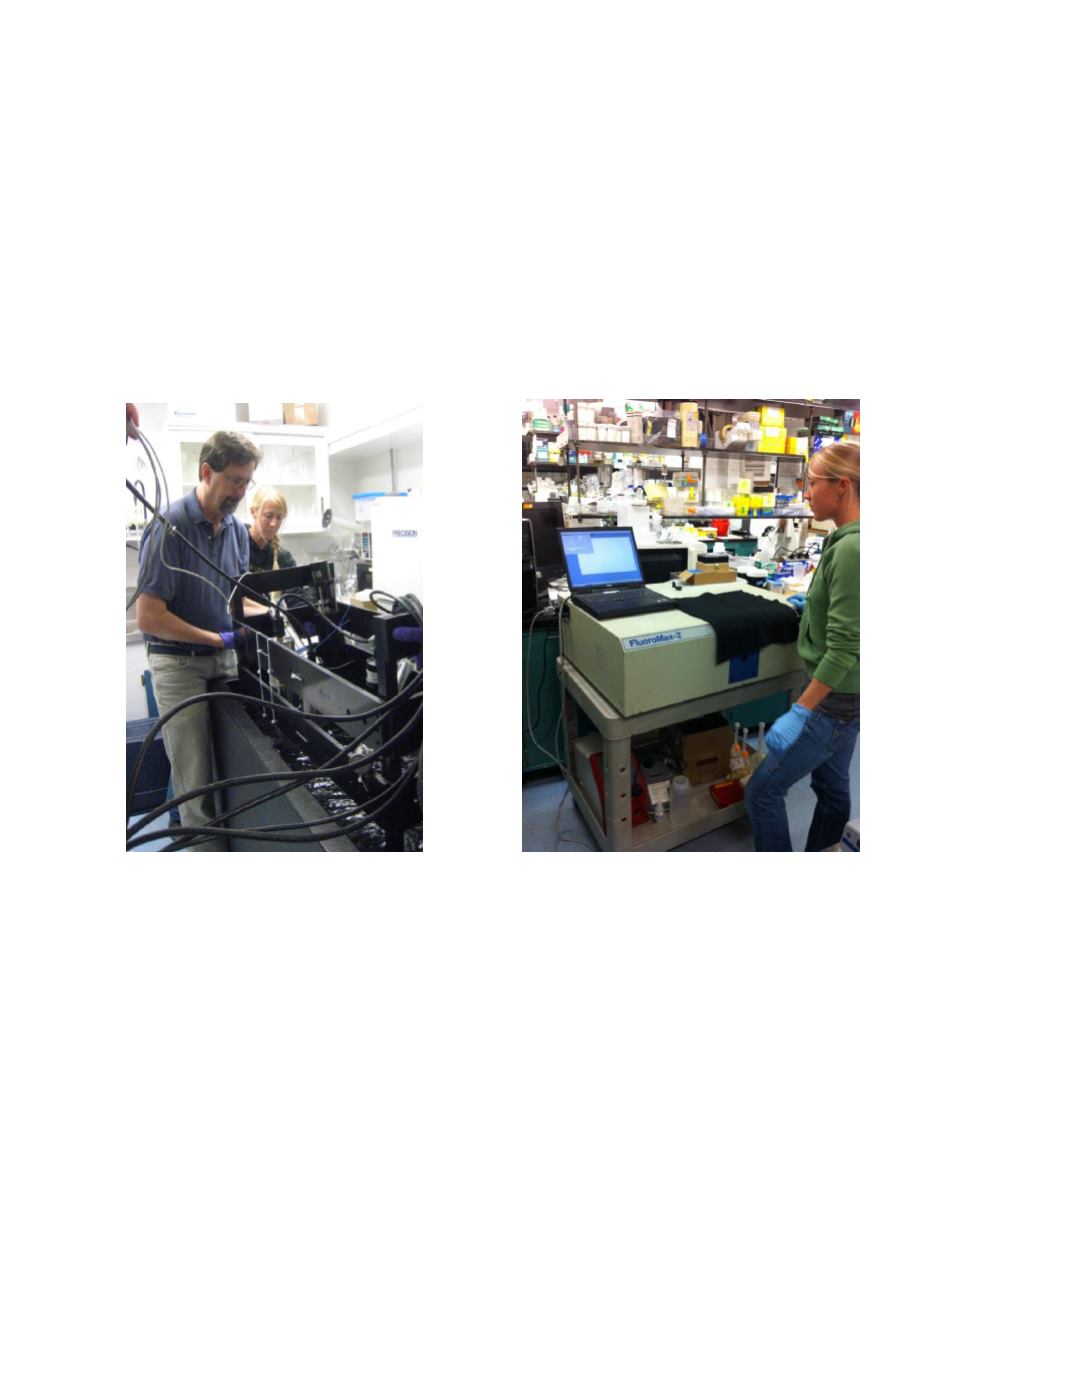
insulated 500 L, black acrylic tanks in a dark room using filtered deionized water (DI) as the
background medium (Photo 1). Reference samples of these challenge compounds were
characterized and quantified using EEMS on a FluorMax-2 (photo 2) over a range of
concentrations from 0 – 5000 ppb (nominally 0, 1, 5, 10, 50, 100, 500, 1000, 5000 ppb).
Photo 1.
Instrument Rack and tank.
Photo 2.
EEM’s Generation
EEM fluorescence maps of each of the five challenge compounds, dosed at a
concentration of 50 ppb, are presented along with the region of the optical window of the Turner
C3-CDOM (Fig. 1), -Crude Oil (Fig. 2) and -Refined Fuel (Fig. 3) sensors. Excitation and
Emission maximums of the challenge compounds varied by over 100 nm, with Quinine Sulfate
mapping most closely with the optical windows of the CDOM and Crude Oil sensor filter sets,
and Carbazole mapping most closely with the optical window of the Refined Fuel sensor filter
set. Response curves for all three sensors were generated against each of the challenge
compounds over concentrations ranging from 1 – 1000 ppb (see Fig. 4 for CDOM, Fig. 5 for
Crude Oil, and Fig. 6 for Refined Fuel). Results show instrument response (in RFU) presented
against both concentration and estimated EEM
QSE
(Quinine Sulfate equivalent) fluorescence
intensity for each challenge compound.
Baseline signal in deionized water was less than 0.5
RFU for the CDOM and Crude Oil Sensors while the Refined Fuel sensor exhibited a higher
baseline offset of approximately 6 RFU. As anticipated from their optical design, the CDOM and
11


