


 14 / 59

Ref. No. [UMCES] CBL 2016-011
ACT VS16-02
14
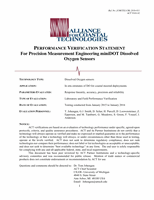
Table 1.
Dissolved oxygen temperature and salinity challenge trial conditions. For each trial pre and post
measurements of tank temperature (
o
C) and salinity (S) were made with an calibrated SBE26+4M CTD,
equilibrated in well mixed tank for 20 min until stable readings obtained.
Trial ID
Mean
Temperature
o
C
S.D.
Temperature
o
C
Mean
Salinity
PSU
S.D.
Salinity
PSU
Levels of
DO tested
mg/L
Figure
for
PME
L_T15_S00
15.44
0.03
0.00
0.000
0, 2, 5,9,10,14
A
L_T15_S10
15.47
0.01
8.82
0.003
0, 2, 8, 9, 13
B
L_T15_S35
15.39
0.03
34.20
0.009
0,2,6,8,12
C
L_T04_S00
5.40
0.08
0.00
0.000
0,4, 12, 17
D
L_T04_S10
5.30
0.03
8.98
0.009
0, 5, 12, 16
E
L_T04_S35
5.23
0.07
34.77
0.073
0, 4, 10, 14
F
L_T30_S00
30.22
0.03
0.00
0.000
0, 3, 5, 9
G
L_T30_S10
30.51
0.12
9.28
0.036
0, 3, 7, 10
H
L_T30_S35
30.61
0.07
34.43
0.050
0, 2, 6, 9
I
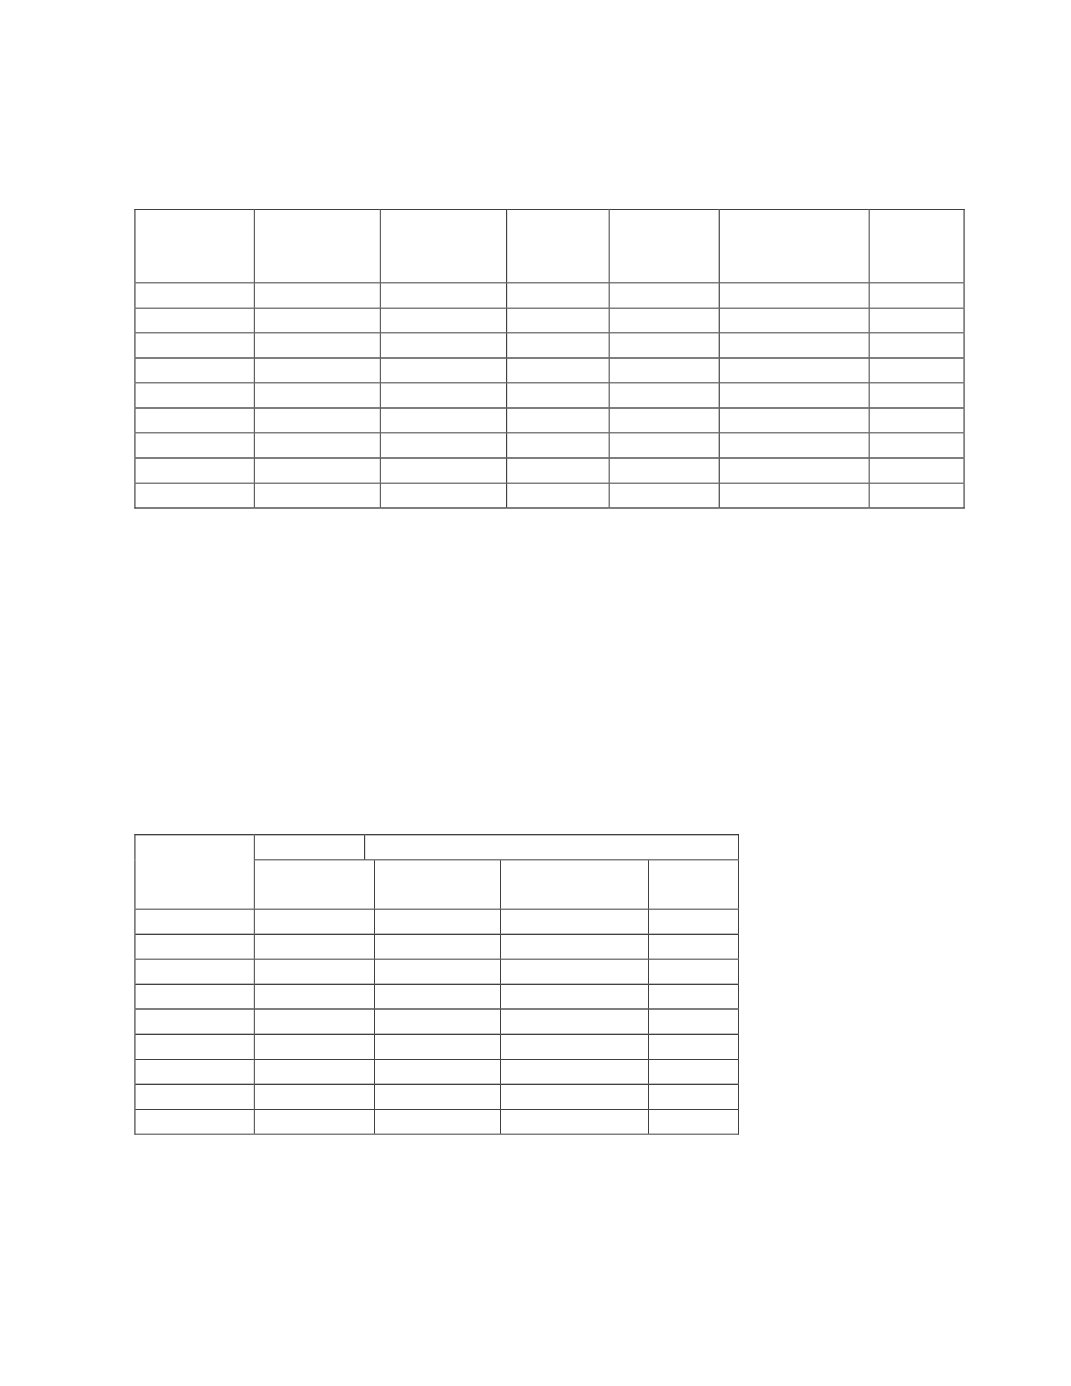
The mean and standard deviation of the differences between the PME miniDOT and
reference measurements for each trial (n = 21 - 40) are presented in Table 2.
Explanations for the
difference between observed and possible comparative observations for the Lab trials are noted in
the respective figure legends. Mean difference among trials ranged from -0.339 to 0.126 mg/L.
There were no consistent trends in instrument accuracy across salinity ranges. There was a
noticeable change in the direction of the offset across temperature ranges with the average offset
equal to -0.23 mg/L for the 4 and 15
o
C trials compared to a mean offset of 0.11 mg/L for the 30
oC trials.
Table 2.
Summary of the mean and standard deviation of offsets between paired PME miniDOT sensor
measures and Winkler reference DO measures during laboratory trials.
Trial ID
Instrument – Winkler DO
mean
s.d.
Observed n
Possible
n
L_T15_S00
-0.339
0.348
28
51
L_T15_S10
-0.291
0.268
21
39
L_T15_S35
-0.087
0.362
38
38
L_T04_S00
-0.201
0.119
39
39
L_T04_S10
-0.164
0.161
36
36
L_T04_S35
-0.336
0.223
37
37
L_T30_S00
0.126
0.081
40
40
L_T30_S10
0.080
0.240
39
39
L_T30_S35
0.109
0.030
40
40