


 63 / 63
Moss Landing Marine Laboratories Field Deployment.
During this deployment the SAMI performed
well for ~3 out of 4 weeks, when the signal became noisy. This noise was possibly due to particles in the
flow cell, as the water at this site (Photograph 2) was very high in particulates. The high particulates
probably also contributed to a large difference between duplicate QC samples (0.021 pH units in ACT
Report, Table 3), which is similar to the offset between the SAMI-‐pH and the QC samples (0.039). This was
the only data set in which the SAMI-‐pH did not correlate to the QC samples, and the likely causes are that
the data from the last week of the deployment are highly scattered, and that the range of the pH signal is
relatively small at this site (≤0.15 Figure 9).
Crimp II Buoy, Coconut Island, Hawaii.
The
SAMI-‐pH had excellent performance during this
deployment, with excellent accuracy compared to
the QC samples (Figures 12 and 13). The HIMB
site is a typical SAMI deployment application.
Ch sapeake Biological Labora ory.
The SAMI-‐
pH performed well for ~3 weeks during this
deployment, after which the fluid path appears to
have become clogged. The correlation between
SAMI-‐pH and QC pH was good, considering we
have done limited testing at this salinity (10-‐13).
Great Lakes Environmental Re earch
Laboratory.
At this site, we deployed 2 SAMIs,
one with mCP and one with PR reagent. pH
measurements with both instruments were
highly correlated to the QC pH, with the PR SAMI
accuracy being better, highlighting the
importance of the accuracy of the equilibrium
constant in the spectrophotometric pH
measurement, as discussed previously.
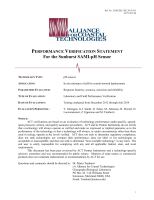
At this site, we had the opportunity to compare temperature from two SAMIs to the QC temperature.
Figure A shows that the temperature of the two SAMIs is very similar, with offsets as large as 2°C from the
QC temperature (top panel), and associated pH difference as large as 0.03 (bottom panel). The difference
between QC and SAMI temperature might be due to stratification, temporal sampling differences during
rapidly changing conditions, and undoubtedly contribute to scatter between SAMI and QC pH
measurements in all field deployments. These challenges were not discussed in the ACT report.
Summary:
These field and lab tests help establish the reliability, accuracy and precision of the SAMI-‐pH
sensor design and have given us opportunity to examine broadening its application. We once again thank
ACT personnel for all their hard work performing this evaluation. It is a very valuable service to the
scientific research community.
Sincerely,
James Beck
CEO/President
Sunburst Sensors, LLC
Mike DeGrandpre
Director, R & D
Sunburst Sensors, LLC
Reggie Spaulding
Research Chemist
Sunburst Sensors, LLC
Figure A.
Difference in temperature measured by
mCP SAMI and SBE (top panel, black), PR SAMI and
SBE (top panel, red), and the associated pH error
from calculating the QC pH with these temperature
errors (bottom panel).
63