Ref. No. [UMCES]CBL 2013-018
ACT VS12-04
RESULTS of LABORATORY TEST
Laboratory tests of response factor, precision, range, and reliability were conducted at
Moss Landing Marine Lab utilizing five different challenge compounds covering a range of
fluorescent properties (see Table 1 above) to facilitate comparisons against the range of optical
detection windows utilized by participating hydrocarbon sensors. Tests were performed in
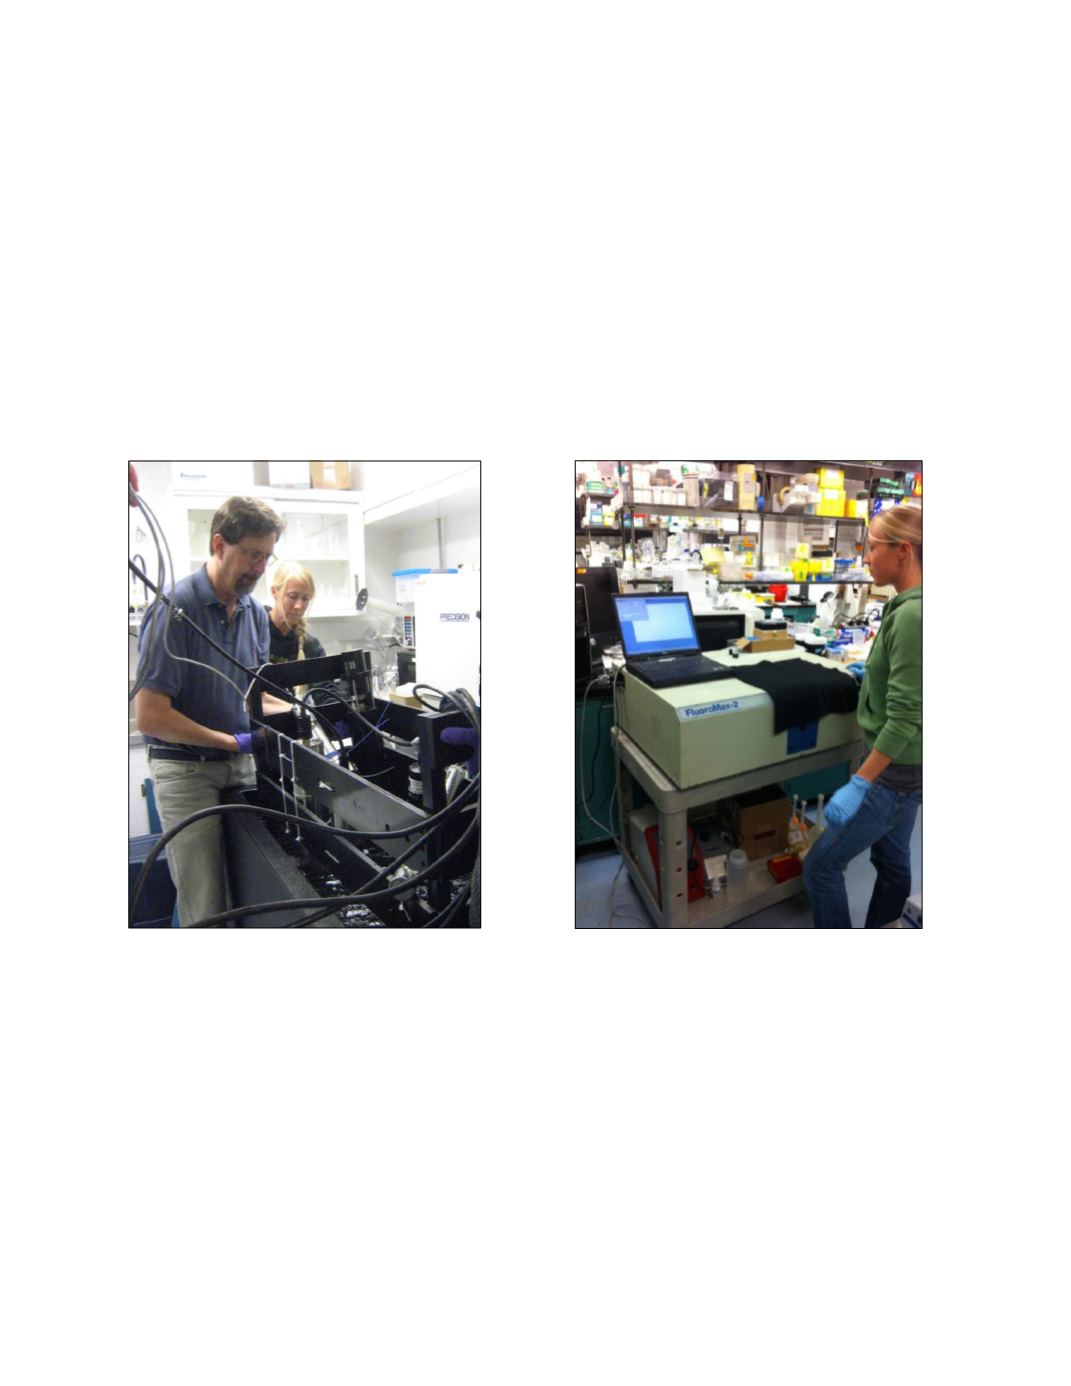
insulated 500 L, black acrylic tanks in a dark room using filtered deionized water (DI) as the
background medium (Photo 1). Reference samples of these challenge compounds were
characterized and quantified using EEMS on a FluorMax-2 (photo 2) over a range of
concentrations from 1 – 1000 ppb plus background at steps of (1, 5, 50, 100, 500 and 1000) .
One challenge compound, Quinine Sulfate, was tested at the additional level of 5000 ppb.
Photo 1.
Instrument Rack and tank.
Photo 2.
EEM’s Generatio
n
EEM fluorescence maps of each of the five challenge compounds, dosed at a
concentration of 50 ppb, are presented along with the region of the optical window of the Hach
FP 360 sc filter set (Fig. 1). Excitation and Emission maximums of the challenge compounds
varied by over 100 nm, with Carbazole mapping most closely with the optical window of the FP
360 sc filter set. The response curves for the FP 360 sc tested against NDSA, QS, Carbazole,
BB3 and #2 Diesel fuel at concentrations ranging from 1 – 1000 ppb (5000 ppb for QS only) are
shown in Figure 2. Results show instrument response (derived as ppb Oil by the logger units’
internal software) presented against both concentration and estimated EEM
QSE
(Quinine Sulfate
equivalent) fluorescence intensity for each challenge compound. As expected by factory design,
the voltage output response to increasing concentration (panel A) and increasing EMM
QSE
11


